
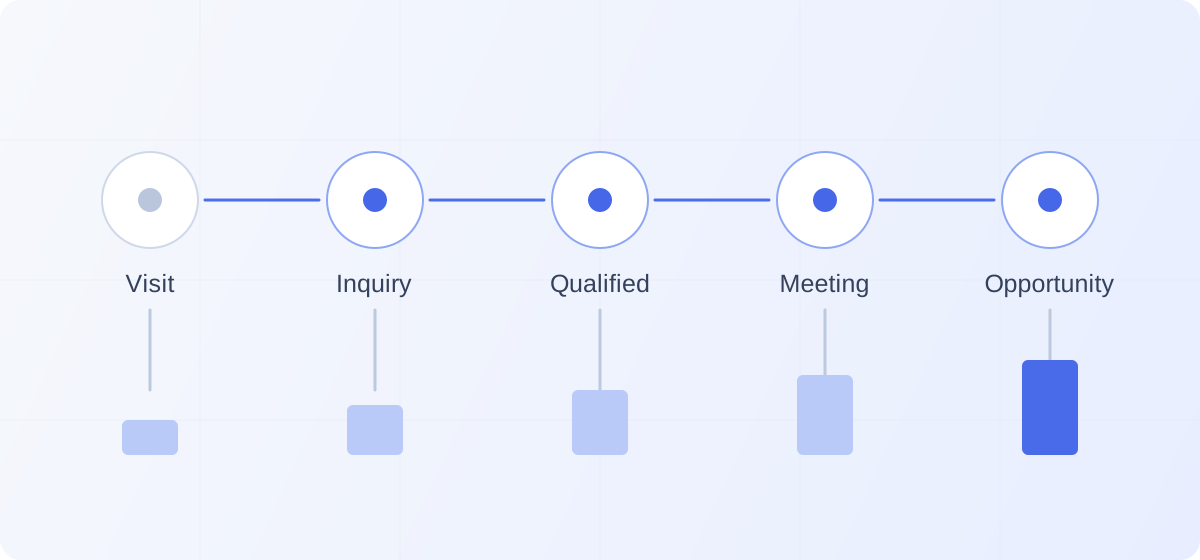
TL;DR: Judge the website by commercial outcomes, not bookings alone: connect visits to inquiries, qualification, held meetings, accepted opportunities, and closed-won business. Define each milestone, name every rate’s denominator, and follow the same prospects over time. More meetings can produce less pipeline, and website-linked pipeline is neither revenue nor proof that the website created it.
Your website booked more meetings this month.
Did it create more business worth pursuing?
A website-to-pipeline funnel connects website activity to commercial outcomes: prospect inquiries, qualification, meetings, accepted opportunities, and eventually customers. Its purpose is to show where relevant interest progresses, where it stalls, and which website journeys produce opportunities your business can serve.
Traffic and engagement help explain the process. Pipeline and customer outcomes tell you whether the process is working commercially.
The useful report connects both.
Without that connection, one team can celebrate a record month for conversions while another struggles to find enough worthwhile opportunities.
The website’s contribution should be visible in the business, not only in the website dashboard.
Give each milestone a different meaning
Begin by agreeing on what happened at each stage.
Opening a conversational interface is not the same as starting a conversation. Asking a product question is not the same as being qualified. Selecting a calendar slot is not the same as attending a meeting.
Each action tells you something. None should inherit the value of the next one automatically.
For a meeting-led B2B business, the following is a useful starting model:
| Milestone | What to record |
|---|---|
| Website visit | A measured visit to the pages included in your analysis |
| Prospect inquiry | A substantive prospect conversation or request through a form or another conversion path |
| Qualified prospect | Evidence that the prospect meets your agreed qualification criteria |
| Confirmed meeting | A booking successfully completed with the intended representative |
| Meeting held | Confirmation that the initial meeting actually happened |
| Accepted opportunity | A specific potential purchase that meets your opportunity-creation standard |
| Qualified pipeline created | The estimated value of those distinct accepted opportunities |
| Closed-won business | The value of opportunities that subsequently became contracted business |
This is an operating model, not a requirement that every prospect follow the same sequence.
Some companies qualify before booking. Others establish enough context to book, then complete qualification in the meeting. A self-serve purchase can follow a different path entirely.
Preserve those differences rather than forcing the business into a convenient diagram.
CRM stages can help keep the distinctions explicit. HubSpot’s default lifecycle stages, for example, distinguish a sales-qualified lead from an opportunity associated with a deal. The stages can also be customized to fit the company’s process.
The important requirement is consistency: everyone should know what evidence advances the record and who is responsible for confirming it.
Make the denominator honest
“Website conversion rate” sounds precise until you ask what is being divided by what.
Are you measuring bookings per session? Prospects per unique visitor? Accepted opportunities per completed meeting?
Those are different questions.
Choose a unit and keep it visible in the metric name.
Google Analytics’ Landing page report is session-based. It shows where sessions begin and allows you to examine traffic sources alongside those entry pages. That is useful for understanding website journeys, but a session is not the same thing as a qualified person.
A prospect can return several times. Several people from one company can investigate the same purchase. An anonymous visit may never be connected reliably to a contact record.
Do not turn those limitations into invented certainty.
For an initial website review, choose a clear scope: perhaps sessions beginning on a set of commercial pages, or visitors to a particular product journey. Keep internal testing and known automated activity out where your measurement supports it. Separate identifiable support and recruitment journeys from prospect acquisition.
Then retain that definition across comparisons.
If one report includes the entire blog audience and another includes only pricing-page visitors, the percentages are not measuring the same opportunity.
Also be careful with the phrase “qualified traffic.” You can select pages and campaigns aimed at your market. That does not establish that every anonymous visitor fits your ideal customer profile.
A denominator should describe what you measured, not what you hope the audience represents.
Use a small set of metrics that explain the journey
You do not need dozens of ratios to begin.
A few clearly defined measures can reveal where the process deserves attention.
Website-to-meeting rate
For a session-based analysis:
Confirmed initial bookings linked to the selected website sessions ÷ sessions in scope × 100.
This tells you how frequently the measured website activity produces an initial booking.
It is a booking rate per session, not a probability that any individual prospect will become a customer.
Track the conversion path as well. A form, an AI SDR, and a scheduling page may all contribute bookings. Keep the total website result visible alongside the individual paths.
Booked-to-held rate
Completed initial meetings ÷ confirmed initial bookings from the same booking cohort × 100.
Use a group of bookings that has had enough time to reach an outcome.
Do not include tomorrow’s meeting as though it failed to happen today. Keep cancellations, no-shows, reschedules, and unresolved bookings distinguishable.
HubSpot provides separate meeting-outcome fields for completed, canceled, no-show, and rescheduled meetings. Its documentation also notes that connected scheduling integrations may use their own properties, so verify which records your report actually reads.
A reschedule should not create another new prospect. Nor should it automatically become a no-show.
Meeting-to-opportunity conversion
For a workflow with one initial meeting per evaluation:
Initial meetings that lead to an accepted opportunity ÷ completed initial meetings × 100.
Choose an observation window and use it consistently.
This helps you assess whether the meetings are leading to commercial situations worth pursuing. It does not explain every rejection by itself.
A low rate might reflect poor qualification, an unsupported requirement, weak discovery, or simply a set of prospects evaluating on a longer timeline. Review the reasons before changing the process.
Pipeline per 1,000 website sessions
Qualified pipeline linked under your stated reporting rule ÷ sessions in scope × 1,000.
This is a normalized measure of pipeline value, not revenue earned from each visitor.
It can help compare website journeys when traffic volumes differ. But a single large opportunity can move it sharply, so show the opportunity count alongside the value.
Keep absolute totals visible, too.
A higher conversion rate from a much smaller audience can still produce less pipeline overall.
More meetings can conceal a worse result
Consider two fictional website cohorts, each observed for the same 60-day period after the initial visit.
For this example, qualification is completed after the first meeting. Each accepted opportunity has an estimated first-year recurring value of $30,000.
These numbers illustrate the measurement, not an industry benchmark.
| Outcome | Cohort A | Cohort B |
|---|---|---|
| Website sessions in scope | 4,000 | 4,000 |
| Confirmed initial meetings | 40 | 56 |
| Initial meetings held | 30 | 40 |
| Accepted new opportunities | 12 | 10 |
| Qualified pipeline created | $360,000 | $300,000 |
A report ending at bookings would celebrate Cohort B. It produced 40% more meetings.
Following the journey reveals a different result.
Cohort A turned 40% of its held meetings into opportunities. Cohort B turned 25% into opportunities. The business spent time on more meetings but accepted fewer potential deals.
Pipeline per 1,000 sessions fell from $90,000 to $75,000.
That does not establish why performance changed. The traffic mix, qualification process, product requirements, or sales conversations could differ.
It tells you where to investigate.
Before increasing the campaign budget or making the booking path more aggressive, examine the additional meetings. What made them unsuitable? Was the limitation visible earlier? Did the prospect understand what they were booking?
A metric earns its place when it helps you choose the next improvement.
Put a defensible value on pipeline
An opportunity needs an estimated value. That estimate should reflect the potential purchase, not the most flattering number available.
Agree on what your pipeline report uses.
Is it first-year recurring contract value? Total contract value? Does it include implementation fees? Are all amounts expressed in the same currency?
HubSpot maintains separate deal properties for annual contract value, annual recurring revenue, and total contract value. Those measures can produce different numbers for the same transaction.
For example, a three-year agreement at $30,000 per year represents $90,000 in total contract value before any additional charges. It does not represent $90,000 in annual recurring revenue.
Choose the basis appropriate to your business and label it.
If the value is not yet established, show that explicitly. Do not silently multiply every booking by your company’s average contract value and present the result as accepted pipeline.
Also distinguish pipeline created during a period from pipeline currently open.
The first records newly accepted opportunities. The second changes as deals progress, close, or lose qualification. An opportunity created last month should not be counted as newly created again because it remains open this month.
Keep a history of changes to value and status so earlier reports remain explainable.
Finally, pipeline is not contracted revenue, collected cash, or profit. A report showing $100,000 of pipeline alongside $10,000 of software spend has not demonstrated a tenfold financial return. The opportunities still need to close, and delivering that business has costs.
Follow the same prospects through time
September meetings divided by September inquiries is not necessarily a conversion rate.
Some September meetings came from August inquiries. Some September inquiries will not reach a meeting until October.
A monthly activity report can still be useful. It tells you what happened during the month.
A cohort report answers a different question: what happened to a particular group after they entered the journey?
Google Analytics describes cohorts as groups sharing a characteristic, such as acquisition date, whose behavior is then examined over time. The same organizing principle is useful when linking website inquiries to later CRM outcomes.
For commercial reporting, you might group prospects by the week they first made an inquiry, then review their progress after 30, 60, and 90 days. Those are example intervals, not universal targets.
Use windows that fit your actual sales cycle.
Keep two views:
The operating view: new inquiries, bookings, completed meetings, and accepted opportunities this week.
The outcome view: what happened to each earlier group after it had time to progress.
This prevents a new campaign from looking weak simply because its opportunities have not matured. It also prevents an established campaign from receiving credit for this month’s revenue without showing when the work began.
Always display the number of observations. Two opportunities from four meetings may be encouraging, but it is a small sample from which to declare a repeatable 50% conversion rate.
Separate the source from the conversion path
A prospect might discover your company through LinkedIn, read an article, return through a search result, and book through a website conversation.
Which part created the opportunity?
Your answer depends partly on the reporting rule. The underlying journey involved several contributions.
Preserve the distinction between how the prospect discovered the business and how they converted on the website.
LinkedIn may be the discovery source. The AI SDR may be the conversion path. A technical article may have helped the evaluation.
Recording one should not erase the others.
Be especially careful with “influenced” pipeline. HubSpot counts contacts as influenced by a campaign when they engage with associated assets, including certain page views, forms, and other interactions. That establishes recorded participation, not proof that the campaign caused a purchase.
For your reporting, define three concepts clearly.
Sourced identifies the origin credited under your chosen rule.
Assisted records relevant participation elsewhere in the journey.
Incremental asks whether additional outcomes occurred because of the intervention.
These should not be treated as interchangeable.
Google makes a similar distinction in its advertising documentation: standard attributed conversions follow configured tracking and attribution rules, while Conversion Lift uses an experimental comparison to estimate additional conversions caused by advertising.
For a website change, apply the same discipline. Where feasible, compare appropriately randomized groups exposed to different experiences and measure total outcomes across all conversion paths.
Where traffic is too limited for a reliable experiment, use a baseline, inspect individual outcomes, and acknowledge other changes that could explain the result.
A conversation associated with a deal is evidence of participation. Demonstrating that it created additional pipeline requires more.
And whatever reporting method you choose, count each opportunity once in the company total. Three stakeholders researching one purchase do not create three purchases.
Connect the records without collecting everything
Useful measurement requires continuity between systems.
The website knows where the visit occurred. The conversational or form system knows what the prospect requested. The calendar knows whether a meeting was booked. The CRM records qualification, ownership, opportunities, and deal outcomes.
Those records need a reliable way to connect where identity is known and collection is appropriate.
At minimum, preserve the conversion timestamp, page or journey, available source information, conversion path, qualification status, meeting outcome, and associated opportunity identifier.
Assign responsibility for each.
Who confirms that the meeting happened? Who accepts or declines the opportunity? Who updates the amount? Who resolves a duplicated record?
Automation can carry the information. It cannot compensate for undefined ownership.
Google Analytics supports separate recommended events for lead generation, qualification, disqualification, and conversion to a customer. Those events must reflect real decisions in your workflow; their names do not establish the outcome by themselves.
Be restrained about the data you send into general analytics.
Keep sensitive conversation content and personal information in systems designed and authorized to hold it. Google Analytics prohibits sending personally identifiable information such as email addresses and personal mobile numbers; its guidance also warns about accidentally including such information in URLs and user-entered fields.
Record gaps honestly. An unknown source is better than an invented one.
Turn the report into a weekly decision
The value of measurement is the work it changes.
Bring website performance and sales outcomes into the same review. Start with the accepted opportunities, then trace the preceding steps.
Where did suitable prospects progress? Where did they stall? Which meetings were declined, and why?
Use the numbers to locate the problem and the underlying conversations to understand it.
If conversation starts rise while useful exchanges do not, inspect the invitation and opening experience.
If qualified prospects reach scheduling but fail to book, inspect availability, routing, and errors.
If meetings happen but few opportunities emerge, compare the website’s qualification decisions with what sales learned.
If accepted opportunities consistently fail later, investigate the gap between the promise made before booking and the requirements uncovered afterward.
Choose one correction, give it an owner, and review whether it changed the relevant outcome.
Avoid redesigning an entire journey because one metric moved for a week.
The objective is to build a repeatable connection between evidence and improvement.
Frequently asked questions
What is the most important website-to-pipeline metric?
Qualified pipeline created is a useful headline measure, provided it represents distinct opportunities that meet a clear acceptance standard. Read it alongside opportunity count, conversion rates, and eventual customer outcomes so one large deal or an inflated estimate does not distort the picture.
Should conversations and demo forms be measured separately?
Yes, to understand how each path performs. Also measure their combined contribution. A new conversation experience may create additional opportunities, shift existing conversions away from forms, or do both. The website total keeps the interpretation honest.
What is a good website-to-opportunity conversion rate?
There is no meaningful universal answer without defining the audience, denominator, qualification criteria, sales motion, and observation period. Establish your own baseline and compare similar groups. An unfamiliar benchmark with different definitions can create more confusion than insight.
How should a low-traffic company measure progress?
Track each relevant inquiry through its outcome and review the reasons for progression or rejection. Show counts alongside percentages, allow enough time for opportunities to develop, and avoid claiming a reliable lift from a handful of events.
Make the number traceable to the prospect
Kassie is built to answer prospect questions, apply a company’s qualification criteria, and help qualified prospects book with the sales team inside the website conversation.
The commercial standard extends beyond the conversation itself.
A useful interaction should leave the prospect better informed and the next step clearer. Measurement should show whether those interactions become opportunities your team has a reason to pursue.
For every qualified-pipeline number, you should be able to find the underlying opportunities. For each opportunity, you should be able to explain how the website helped the prospect progress.
That is how the website earns its place as a revenue channel.